Project Information and Reproducibility Guide
View the Project on GitHub LabNeuroCogDevel/Cortical_SNR_Development
Prefrontal Excitation/ Inhibition Balance Supports Adolescent Enhancement in Circuit Signal to Noise Ratio
The development and refinement of neuronal circuitry allow for stabilized and efficient neural recruitment, supporting adult-like behavioral performance. During adolescence, the maturation of PFC is proposed to be a critical period (CP) for executive function, driven by a break in balance between glutamatergic excitation and GABAergic inhibition (E/I) neurotransmission. During CPs, cortical circuitry fine-tunes to improve information processing and reliable responses to stimuli, shifting from spontaneous to evoked activity, enhancing the SNR, and promoting neural synchronization. Harnessing 7T MR spectroscopy and EEG in a longitudinal cohort (N = 164, ages 10-32 years, 283 neuroimaging sessions), we outline associations between age-related changes in glutamate and GABA neurotransmitters and EEG measures of cortical SNR. We find developmental decreases in spontaneous activity and increases in cortical SNR during our auditory steady state task using 40 Hz stimuli. Decreases in spontaneous activity were associated with glutamate levels in DLPFC, while increases in cortical SNR were associated with more balanced Glu and GABA levels. These changes were associated with improvements in working memory performance. This study provides evidence of CP plasticity in the human PFC during adolescence, leading to stabilized circuitry that allows for the optimal recruitment and integration of multisensory input, resulting in improved executive function.
Project Lead
Shane D. McKeon
Faculty Lead
Beatriz Luna
Project Start Date
September 2023
Current Project Status
Published in Progress in Neurobiology (2024) as Prefrontal Excitation/ Inhibition Balance Supports Adolescent Enhancements in Circuit Signal to Noise Ratio
Datasets
LNCD 7T
Github Repository
https://github.com/LabNeuroCogDevel/Cortical_SNR_Development
Code Documentation
Preprocessing:
Preprocessing can be run using 01_Cortical_SNR_Preprocessing.sh
matlab -nodesktop -r "addpath(genpath('../Preprocessing_Functions/')); run_preprocessing_pipeline('SNR')"
- Initial preprocessing was done using matlab code run_preprocessing_pipeline.m (../Preprocessing_Functions) which first pulls in raw data from ‘Raw/EEG/7TBrainMech’.
- Set the task as ‘SNR’ to select the auditory steady state data.
- Bandpass filter between 0.5 Hz and 70 Hz
- Downsamples the data from 1024Hz to 512 Hz
- Removes bad channels (the following criterion is used)
- arg_flatline: 8
- Maximum tolerated flatline duration. In seconds. If a channel has a longer flatline than this, it will be considered abnormal.
- arg_highpass: [0.25 0.75]
- Transition band for the initial high-pass filter in Hz. This is formatted as [transition-start, transition-end]
- arg_channel: 0.7
- Minimum channel correlation. If a channel is correlated at less than this value to a reconstruction of it based on other channels, it is considered abnormal in the given time window. This method requires that channel locations are available and roughly correct; otherwise a fallback criterion will be used.
- arg_noisy: 5
- If a channel has more line noise relative to its signal than this value, in standard deviations based on the total channel population, it is considered abnormal.
- arg_burst: 15
- Standard deviation cutoff for removal of bursts (via ASR). Data portions whose variance is larger than this threshold relative to the calibration data are considered missing data and will be removed.
- arg_window: 0.3
- Criterion for removing time windows that were not repaired completely. This may happen if the artifact in a window was composed of too many simultaneous uncorrelated sources (for example, extreme movements such as jumps). This is the maximum fraction of contaminated channels that are tolerated in the final output data for each considered window.
- arg_flatline: 8
- Interpolates missing channels
- Dataset includes a few subjects that used a 128 cap as opposed to a 64 channel cap. The code removes the 4 channels that are found in 128 but not 64 and reinterpolates the missing channels that were removed from above
- Run ICA to identify eye movements and blinks
- Homogenize Channel locations
- Read in the channel locations and make sure all files have the correct locations, especially the few subjects who were ran using a 128 channel cap
- Filter out 60 Hz artifact from line noise
Calculate Total, Evoked, and Spontaneous Activity:
Run the bash script 02_CreateIndividualSubjectFiles_EvokedSpontaneous.sh
matlab -nodesktop -r "addpath(genpath('code/')); totalEvokedSpontaneous('4')"
- Creates individual csv fies for every subjects for every electrodes with their total, evoked, spontaneous activiy
- Calls totalEvokedSpontaneous.m (Cortical_SNR_Deveopment/code)
- Input: triggerValue
- 2: 20 Hz condition
- 3: 30 Hz condition
- 4: 40 Hz condition
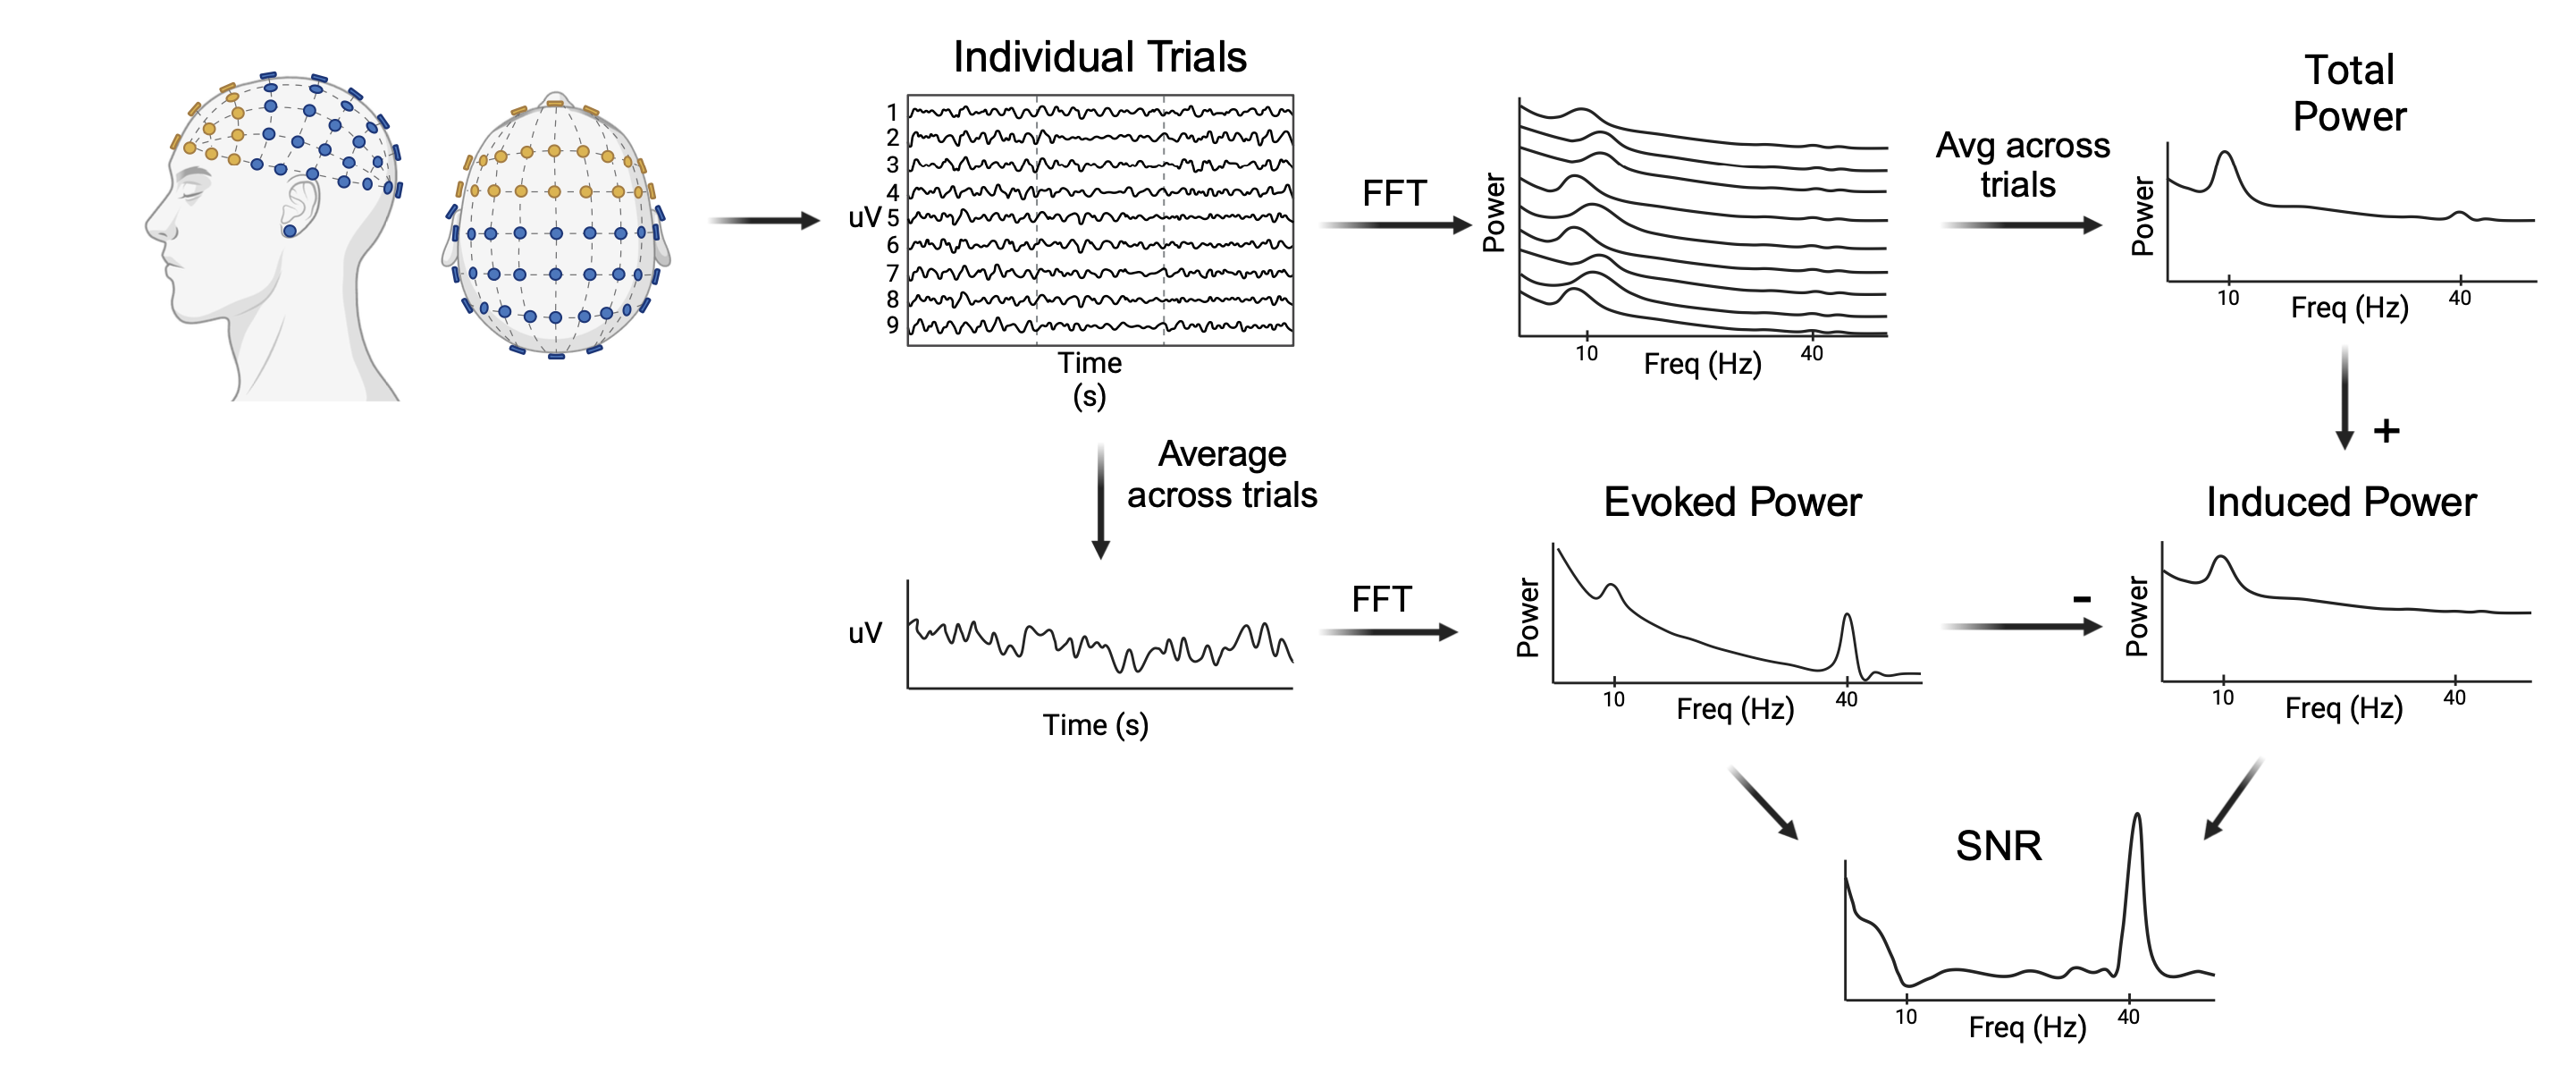
Cortical signal-to-noise ratio (SNR) was computed by calculating the evoked (stimulus-locked) and total power during the 20, 30, and 40Hz click train frequency conditions. Prestimulus values (-200 to 0ms) were extracted to provide a baseline reference. A task epoch was then defined over the first 800ms following stimulus onset, and the auditory steady state response (ASSR) was computed for each electrode based on methods based on previous literature. Briefly, a Fast Fourier Transform (FFT) was applied to each single-trial epoch, resulting in per-trial power spectra. Power spectra were then averaged across trials to compute total power as a function of frequency. Evoked power was then derived by averaging the single trial time courses and calculating the resulting power spectra using FFT. By averaging across trials, only activity which was consistently timed relative to the stimulus onset remained, providing an estimate of the stimulus-evoked power. Spontaneous power was then derived by subtracting the evoked power from the total power. Finally, SNR was calculated as the ratio of evoked power to spontaneous power. A methodological representation of the method can be seen in the figure below.

Combine Individual Subject Files:
03_CombineSubDataframes.R
#!/usr/bin/env Rscript
source("code/CombineSubjectDataFrames.R")
combineSubjectDataframes(20)
- Select the frequency you want to analyze
- 20: 20 Hz condition
- 30: 30 Hz condition
- 40: 40 Hz condition
- This will create one csv files with all subjects and all electrodes for one of the frequency conditions
Combine All Stimulus Conditions:
04_combineAllStimConditions.R
- Combines the csv files on the previous step into one large csv files with all frequency stimulus conditions
- Preforms outlier detection (2 SDs above the mean)
Impute missing data and Calculate frontal region PCA:
05_createImputed_PCA_dataFrames.R
Prior work has shown that ASSR is maximal at the frontal central electrodes Fz and FCz and then disperses amongst the frontal central electrodes surrounding it. To account for this spatial signal spread, we performed a principle component analysis (PCA) to reduce the dimensionality of the data for each of the total, evoked, and spontaneous power, as well as SNR. Due to both prior work and our hypotheses regard prefrontal cortex plasticity, the PCA was restricted to frontal electrodes, that is, F3, F5, F7, F1, F2, F4, F6, F8, AFz, AF1, AF2, Fp1, Fp2, Fz, AF5, AF6 (per the 10-20 international system naming convention). In each case, the first principal component (PC) captured the bulk for the signal variance and was used for subsequent analyses.
Due to missing data from outlier detection on each electrode, we imputed the missing data, using RStudio package mice100, for each subject so not to lose subjects who did not have complete data for all channels. Individual outliers were then detected using 2 standard deviations from the mean for each PC value for the evoked, spontaneous and SNR measures, as well as the MRSI derived measures, Glu, GABA, and Glu/GABA asymmetry.
Figures and Statistics:
06_SNR_Results.Rmd
To assess developmental trajectories of cortical SNR activity, we implemented GAMMs on the first principal component, PC1, of evoked power, spontaneous power, and SNR, including random intercepts estimated for each participant. Regression splines were implemented (4 degrees of freedom) to assess linear and non-linear effects. Auditory measures that were found to significantly change across adolescence were then used to test for associations with our MRSI measures, glutamate (Glu), GABA, and Glu GABA Asymmetry using linear mixed effect models (lmer function, lme4 package in Rstudio). We first tested for significant main effects of the auditory measure on the MRSI parameter while controlling for age and hemisphere (left or right DLPFC). We additionally tested for auditory measure-by-age interactions while controlling for hemisphere. We then investigated whether our auditory measures had significant associations with our working memory measures (accuracy, accuracy trial variability, response latency, response latency variability) using linear mixed effect models (lmer function, lme4 package in Rstudio).
Project Software
The following external software was used for this project:
MATLAB: eeglab 2022.1
R version 4.2.3; packages: dplyr, ggplot2, caret, mtcars, grid, gridExtra, plotrix, mgcv, readxl, lme4, lmerTest, tidyr, jtools, mice, scales